
How to secure your Google Analytics Universal data
— Written by Tim Brack
Google Analytics has long been an important tool for marketers and fundraisers keen to understand how their digital campaigns perform / how their content is being viewed / and ultimately if people are doing the things (on their website) that they want them to do.
With Google stopping the collection of data in Google Analytics Universal web properties between July and August 2023, you’ll want to secure your historical reports for use in the future.
Exporting your Google Analytics data means you’ll be able to do multi-year comparisons with your Google Analytics 4 reports. Want to compare your Christmas appeal to past years? Make sure to export that data.
There are a bunch of different ways to get data out of Google Analytics Universal, from manual exports (boo) to a direct connection with the API (too complicated, double boo). There’s also a convenient method between these two options – using Google Sheets with a (free) add-on to pull the data straight out 🤩.
The rest of this article gives you step-by-step for using the Google Sheets add-on to export your Google Analytics Universal data.
Create a new Google Sheet & install the add-on
First up, we’re going to create a new Google Sheet, and install the add-on for Google Analytics.
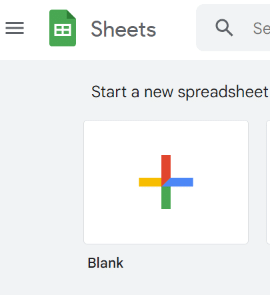
1. Go to Google Sheets – sheets.google.com, and create a new blank sheet.
2. In your new sheet, go to Extensions > Add-ons > Get Add-ons

3. Search for ‘Google Analytics’ in the search box that appears in the modal window

4. Choose the ‘Google Analytics‘ add-on by ‘google-analytics-add-ons’ (which is the official Google Add-On). Make sure to choose the right one, and only give permissions to add-ons that you truse.
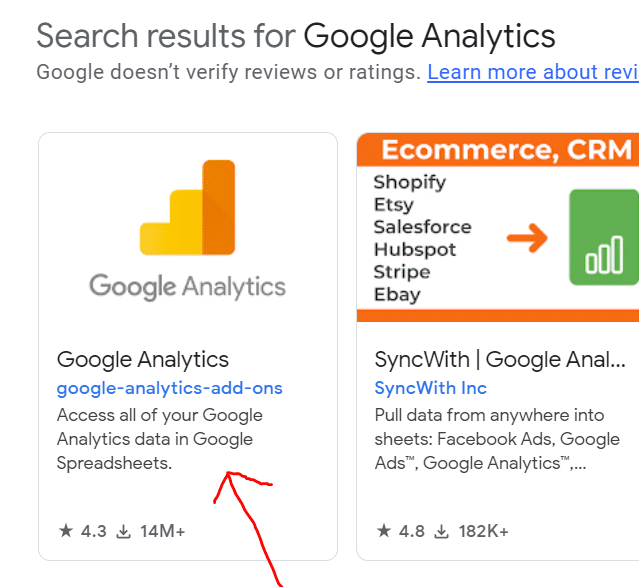
5. Click the ‘Install’ button

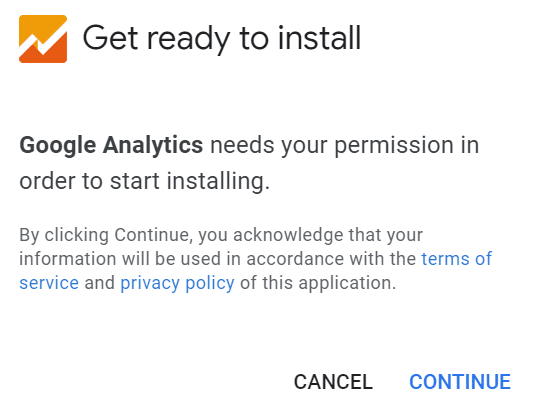
6. Go through the permission / authorisation steps
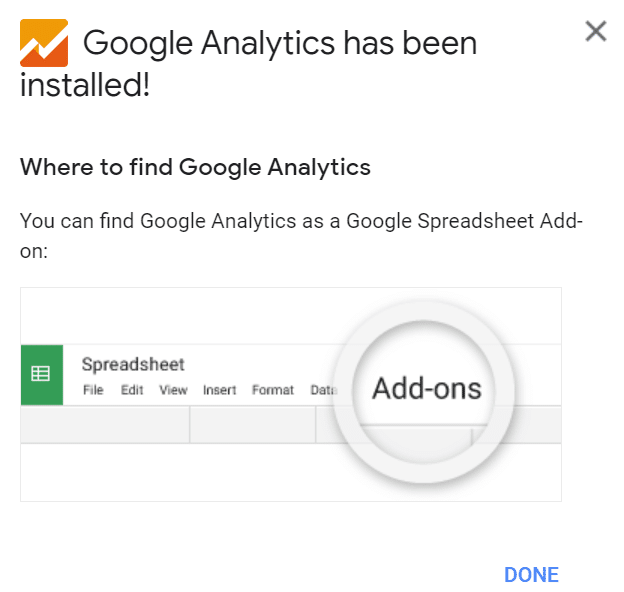
7. If you’ve done the authorisation, the add-on will now be installed 🥳
Okay, your first step is done… let’s pause and have a party 🥳🎉
Create your first Google Analytics export
The add-on is installed… now we can start to use it to pull data out of Google Analytics.
There are two main parts to using the export tool:
- using the report wizard to expose the report settings
- running the report(s)
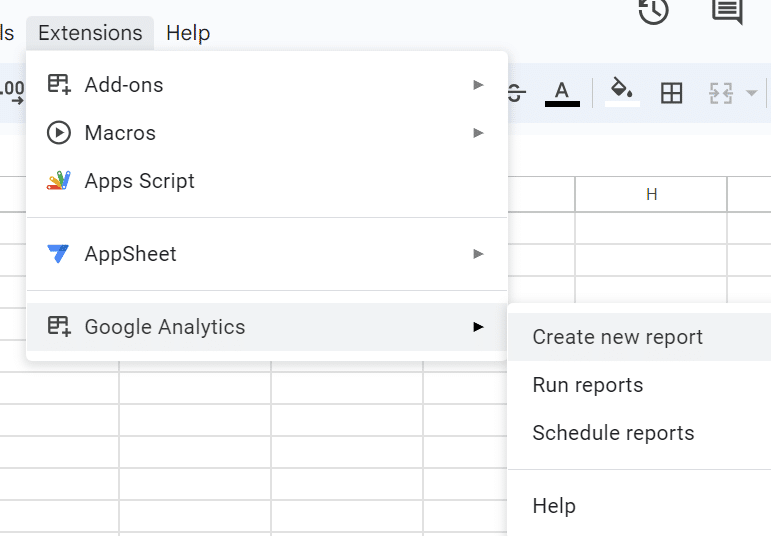
1. In the new Google Sheet you’ve just created, go to Extensions > Google Analytics > Create new report
2. Google Sheets will have added a new panel on the right-side of the screen
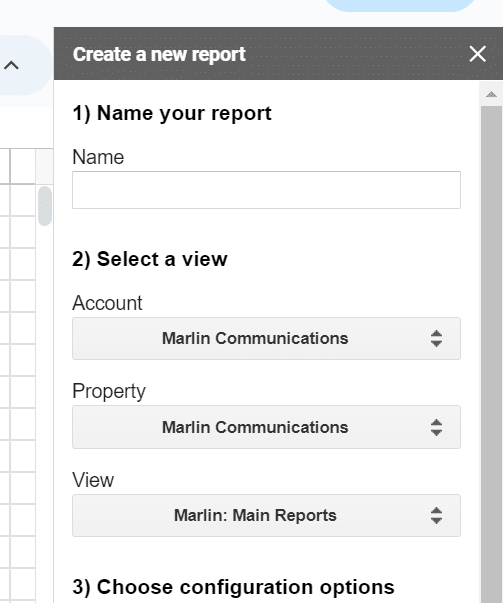
3. Give your report a name… this will become the name of a tag in Google Sheets

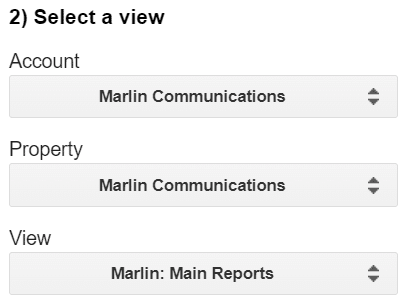
4. Select the Google Analytics Account > Property > View that you want to pull data from for this report.
NOTE – if you can’t see the right account, it means that the login you’re using in Google Sheets does not have the right permissions to Google Analytics. If possible, try to use the same login / user that you have for Google Analytics for this Google Sheet export.
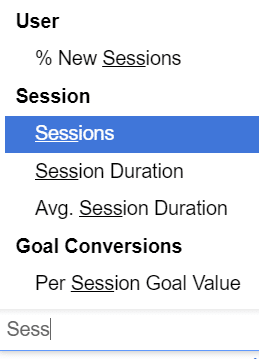
5. Add some metrics and dimensions – this isn’t the final place where you can choose or edit these, so lets just get started simple. For metrics, choose: ‘Sessions’. For dimensions, choose: ‘Landing Page’.
NOTE – you can search for these
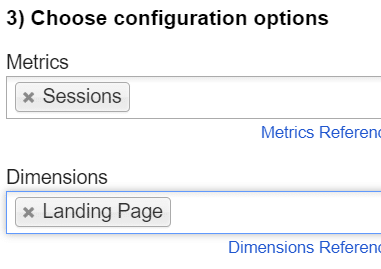
6. Go ahead and select ‘Create Report’

Strangely enough, this creates the configuration for your report, but it doesn’t “run” the report (i.e. the data isn’t exported yet). We can do that next…
Run your export report
You’ve got the add-on, you’ve configured a report… let’s export that data!
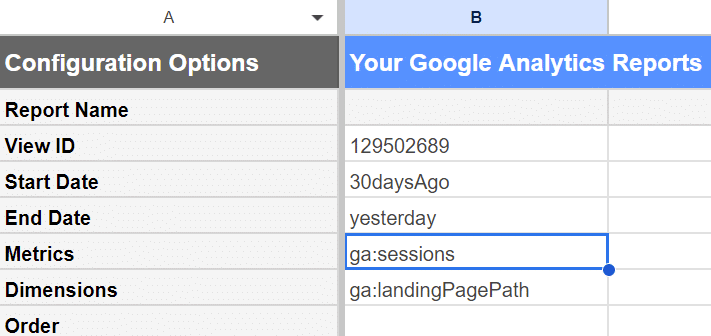
1. You’ll have a new tab in Google Sheets called ‘Report Configuration’
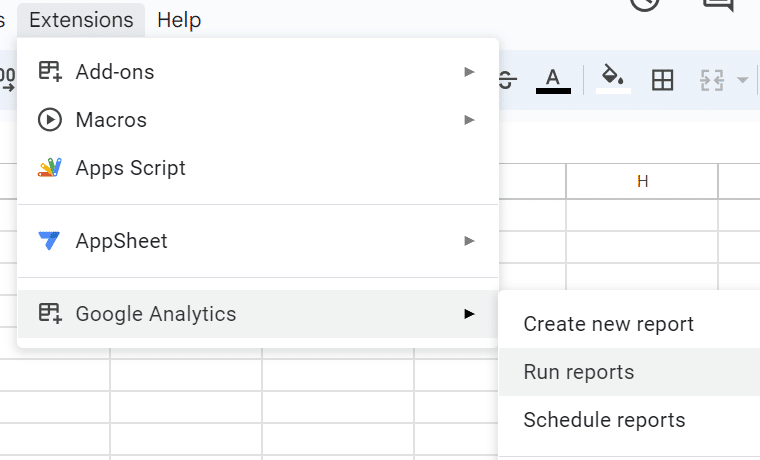
2. Go to Extensions > Google Analytics > Run reports
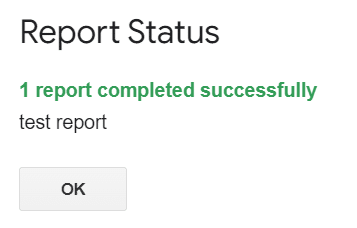
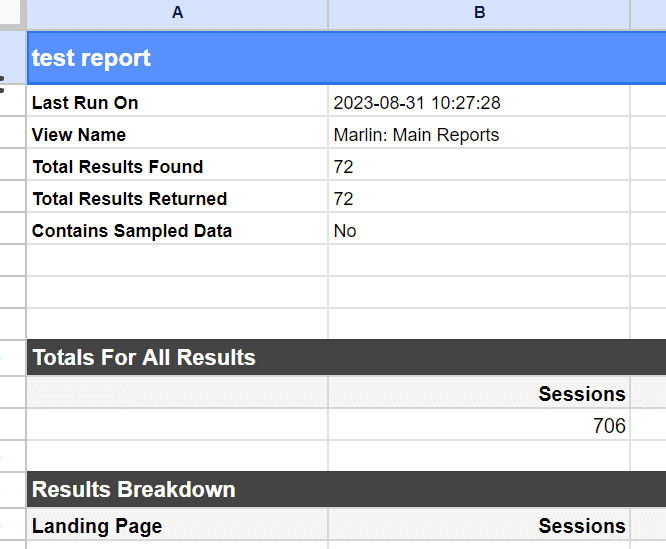
3. The report will run, Google Sheets will grab the data from Google Analytics and show you a success message (or an error message)
4. A new tab will be created with your export data
Alrightey… time for another party! 🥳
More reports, more data, more options
We’ve just done a super simple export so far – pulling the sessions and landing pages for the last 30 days of website traffic.
The export tool can pull most of what is in Google Analytics out to Google Sheets… all these options are controlled back in the ‘Report Configuration’ tab in Google Sheets.

Let’s take a quick look at some of the configuration options.
The Report Name maps to the name of the tab in Google Sheets – if you update it in the configuration it will create a new tab (unless you update the tab name as well).
The View ID maps to the View in Google Analytics where the data is being pulled from (you should leave this as is).

Start Date and End Date are the dates that your report is for. Do you want the last 30 days? Do you want a specific date range? Enter the start and end date. Note that the date format should be YYYY-MM-DD

The Metrics and Dimensions are the actual data that we’re pulling out of Google Analytics — the numbers (e.g. sessions, transactions, bounces, etc.) and the labels (e.g. landing page, page, country, etc.).
📜 NOTE – metrics and dimensions are entered in a weird way, with “ga:” at the start, and the list is comma separated. A full list of the metrics and dimensions is available at the Google Analytics Metrics and Dimensions Explorer.
example: ga:sessions,ga:bounces

Order is all about how you would like to sort your data. e.g. sort descending by sessions would be ‘-ga:sessions’
Filters and Segments can get a bit complicated. If you’re looking for more information or help with the add-on, there is a write up from Google here:
Need help?
If you’re a nonprofit that needs help getting your data out of Google Analytics (and making sense of it), get in touch with us over at Marlin.


